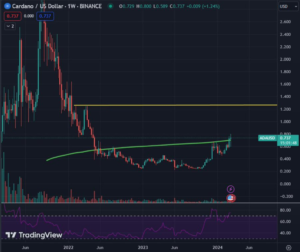
Analysts and traders both are pointing to Cardano’s strong technical evidence, indicating that the coming week could be game-changing for ADA holders.
Sssebi, a popular analyst, turned to Twitter to express his bullish perspective. “If you are ever concerned about $ADA, just look at the weekly chart,” he stated in a blog post. “Above the 200-week moving average, with some massive weekly green candles and strong buying pressure. Next week will be enormous for $ADA; there isn’t much resistance until $1.2, thus we could see a 50-60% spike.

The 200 Week Moving Average is a long-term trend indicator that smoothes price data over 200 weeks. When a cryptocurrency’s price exceeds this average, it is often regarded as a bullish indication, indicating that the long-term trend is higher.
AltFINS, another renowned crypto analysis group, echoed Sssebi’s stance by sharing their own Cardano trade setup. “Price is in an uptrend,” they stated. “Bullish break above $0.68 resistance, where it got rejected in late 2023, signals continuation of uptrend, with positive 47% upward potential to $1.00 next.”
In technical analysis, levels of resistance are prices where a cryptocurrency has previously seen selling demand, making it difficult for its value to move above that level. In contrast, support levels are prices at which buyers have intervened, preventing the price from falling lower. Getting past a critical resistance level, as Cardano achieved at $0.68, is commonly interpreted as a bullish indication.
AltFINS also identified several crucial levels to monitor: “The nearest support zone is $0.65 to $0.68 (prior resistance), followed by $0.46. The nearest resistance zone is $0.80, followed by $1.00.
With Cardano today priced at $0.72, speculations of a spike to $1.00 or even $1.20 kept investors on edge, eagerly anticipating the following week’s price movement.
Release: The purpose of this content is only to provide knowledge. Readers have to do their own research before making investment decisions.


